
ChatGPT vs Google on 500 Search Queries
Next | Issue #57

You might have seen news reports of this new shiny kid on the block: ChatGPT. Chances are, you might even have tried it yourself. It is really good. Better than what we expected from a computer.
Today’s letter will talk about ChatGPT and AI, demonstrate why the super-rich is inevitable in the economy, show a misleading graph that the Federal Reserve Bank shared, and more. Let’s dive in!
Five Stories
1. Exaggerating China’s military spending, St. Louis Fed breaks all statistical rules with misleading graph
Ben Norton
On January 22, 2023, the Fed tweeted a graph showing how defence spending has changed over the years for major countries.


Notice the two y-axes in this plot. The right one represents the United States’ expenditure on defence. It starts from $400 billion and goes to $1 trillion. The left one represents other five countries’ expenditure on defence. It starts from $0 and goes to $300 billion — below the starting point of the other axes. Thus, no matter how low the US expenditure is, it is at least $100 billion more than everyone else.
As it turns out, even $100 billion is a gross underestimate. When you plot all countries with the same y-axis, this is how it looks.

In fact, US spends more on defence than the next nine countries combined. Here’s OWID’s data and map on millitary expenditure per capita for your exploration.
2. Logistic regression (by hand)
Max Rohde
Logistic regression is one of the first methods taught in regression, econometrics or a machine learning class. While packages and functions can do most of the work for us, illustrating the method “by hand” can improve our understanding fundamentally. (I remember how coding a multi-layered perceptron taught me what backpropagation is.)
The article is about logistic regression, a method for estimating the probability of an observation belonging to one of two classes based on a vector of covariates. Max discusses the implementation of logistic regression by hand to help understand the method better, even though it may not be practical to use the implementation for real data analysis projects. He demonstrates how likelihood function is written and how to use optim() for optimising it. Jump in!
3. We Evaluated ChatGPT vs. Google on 500 Search Queries
Edwin Chen
We measured ChatGPT vs. Google, and found that ChatGPT crushes Google on coding queries and ties it on general informational queries — despite not being optimized for a search experience at all.
If you have tried ChatGPT, you know how useful it is. Instead of asking Google for synoyms, you can ask GPT to rewrite the sentence. Instead of pasting the error code in Google/StackOverflow, you can ask GPT what’s wrong in your code.
SurgeHQ asked 100 of its employees to share five pre-2022 informational queries. They presented them to GPT and Google while rating their performances. 42% preferred ChatGPT, 40% preferred Google. Specifically for coding queries, GPT was best 70% times. Asking for receipes was also cleaner with GPT than web results. The ability to ask follow up questions is a game changer.
Sidenote: WebGPT is either already ready and under the wraps, available only to OpenAI’s sponsors; or we will see it soon. Maybe in Bing.
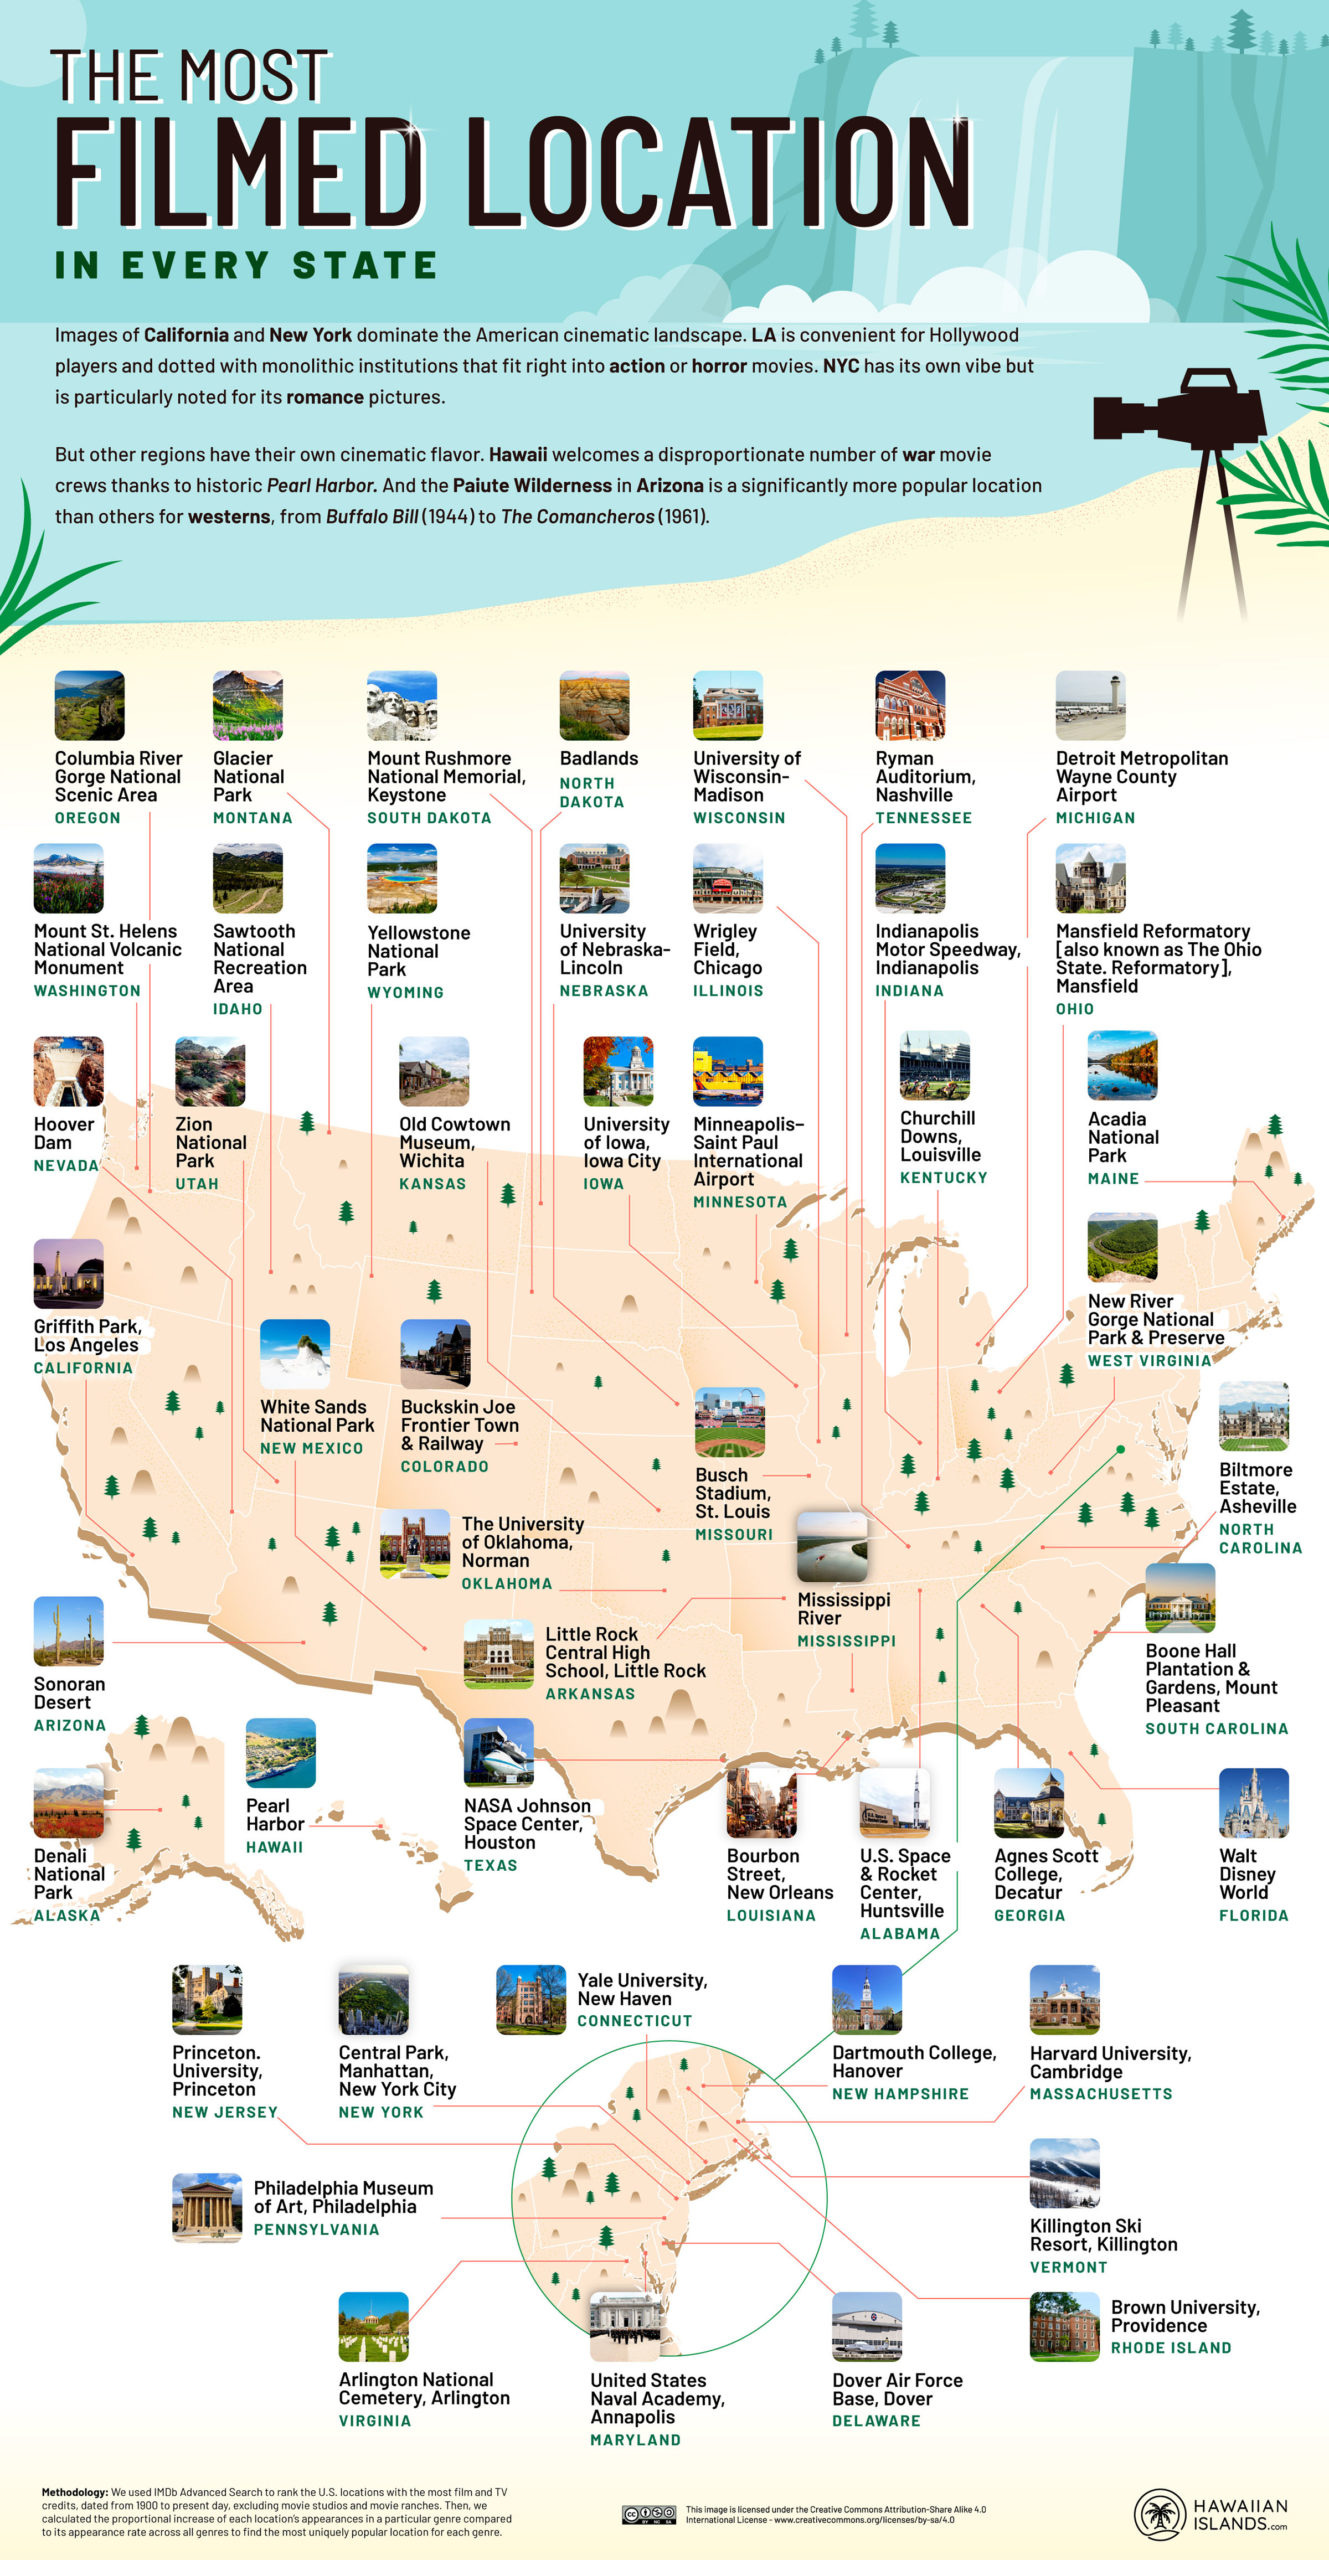
4. The Most Filmed Locations in Every State
The Hawaiian Islands
Cinema was born in France, but it grew up in Hollywood.
The U.S. movie industry, which makes more money than any other, is dominated by California and New York shoots. A study by HawaiianIslands.com analyzed IMDb data to find the U.S. locations with the most film credits, excluding studios, and ranked them by state, type, and genre.
The study found that Griffith Park in LA is the most filmed location with 399 credits, and Pearl Harbor in Hawaii is the top film location with 17 credits. Union Station in LA has more credits than other iconic locations such as the White House and Grand Central Station, but it rarely appears as itself in films.
4. Why the super rich are inevitable?
The Pudding
In a classic Pudding scroll, we learn how some individuals end up as super rich by pure chance. This is true with no taxes and higher taxes can prevent it… to an extent.
The Yard-sale model, developed by physicist Anirban Chakraborti, is a simulation that shows how uneven trades can lead to a concentration of wealth in the hands of a few people. Physicists got involved in studying inequality through the field of econophysics, where they applied their methods to economics. The Yard-sale model demonstrates that government intervention and taxation can help redistribute wealth and prevent a single person from accumulating all the wealth.
5. Winners of the 2022 Table Contest by Posit
Rich Iannone and Curtis Kephart | Posit PBC.
There are many R and Python packages available that allow for generating visually appealing tables, and the community has produced a lot of examples and tutorials on how to use these tools effectively.
Winner: Karina Bartolomé showed that it is possible to create fully featured table in Python, in addition to what can be done with R. Her blog presents side-by-side comparison of what is possible in pandas and gt. See her tables.
Runners-up: Josh Fangmeier explored AmTrak Passenger Rail System, Jack Davison recreated DuBois’ gallery, Matthew Kumar made an interactive table app, and Tanya Shapiro made a table of New York Times Best Selling Authors with ggplot2. Her website’s gallery is <3.
Four Packages
Twint is a Python / CLI app that can scrap data from Twitter without using its API. Thus, it doesn’t have any rate limits. GitHub.
GGanimate is an R package that can be used to make animated plots. Medium. GitHub.
Scales is used for modifying scales in ggplots — log-transform, custom breaks, custom formats, etc. GitHub.
MetaboAnalystR is a package containing the R functions and libraries used by the MetaboAnalyst web server for metabolomics data analysis, visualization, and functional interpretation. It is synchronized with the web server and allows users to reproduce results on their local computers, providing maximum flexibility and reproducibility. GitHub.
Three Jargons
Gradient Boosting: A powerful machine learning algorithm that builds a sequence of weak models and combines their predictions to make a stronger prediction.
Feature Engineering: The process of creating new features from existing features to improve the performance of a machine learning model.
Regularization: Regularization is a technique used to prevent overfitting by adding a penalty term to the cost function. This term discourages the model from fitting the data too closely and encourages simpler models with lower variance and higher bias.
Two Tweets


One Meme

That’s a wrap!
As you might have noticed, I snuck in a quick citation to a Python package today. Expect more of them in the coming editions as I plan to expand the scope of this letter from R to Data Science.
Harsh