


February 2024: Data Dives and Diverse Discoveries
Informative insights from nuclear maps and asian food, to data overfitting and health

Hello February!
It has already been a month into 2024. I cannot believe how fast the time flew. 🎐
This month, we're taking a deep dive into a variety of intriguing topics. We start by exploring the chilling impact of nuclear fallout with Alex Wellerstein's Nuke-map, examining potential scenarios in Washington DC, New Delhi, and Moscow. We shift gears to the world of aviation, uncovering a fascinating dataset on flight delays and patterns.
Our journey continues with Nero.AI, a web-scraper powered by LLMs, and an insightful look into some lesser-known yet handy R functions. We also delve into the prevalence of Asian cuisines in the U.S., revealing some surprising statistics.
Finally, we wrap up with an overview of Python libraries like Pandana and Leafmap, essential tools for spatial analysis and interactive mapping. Let’s dive in!
Nuke-map by Alex Wellerstein
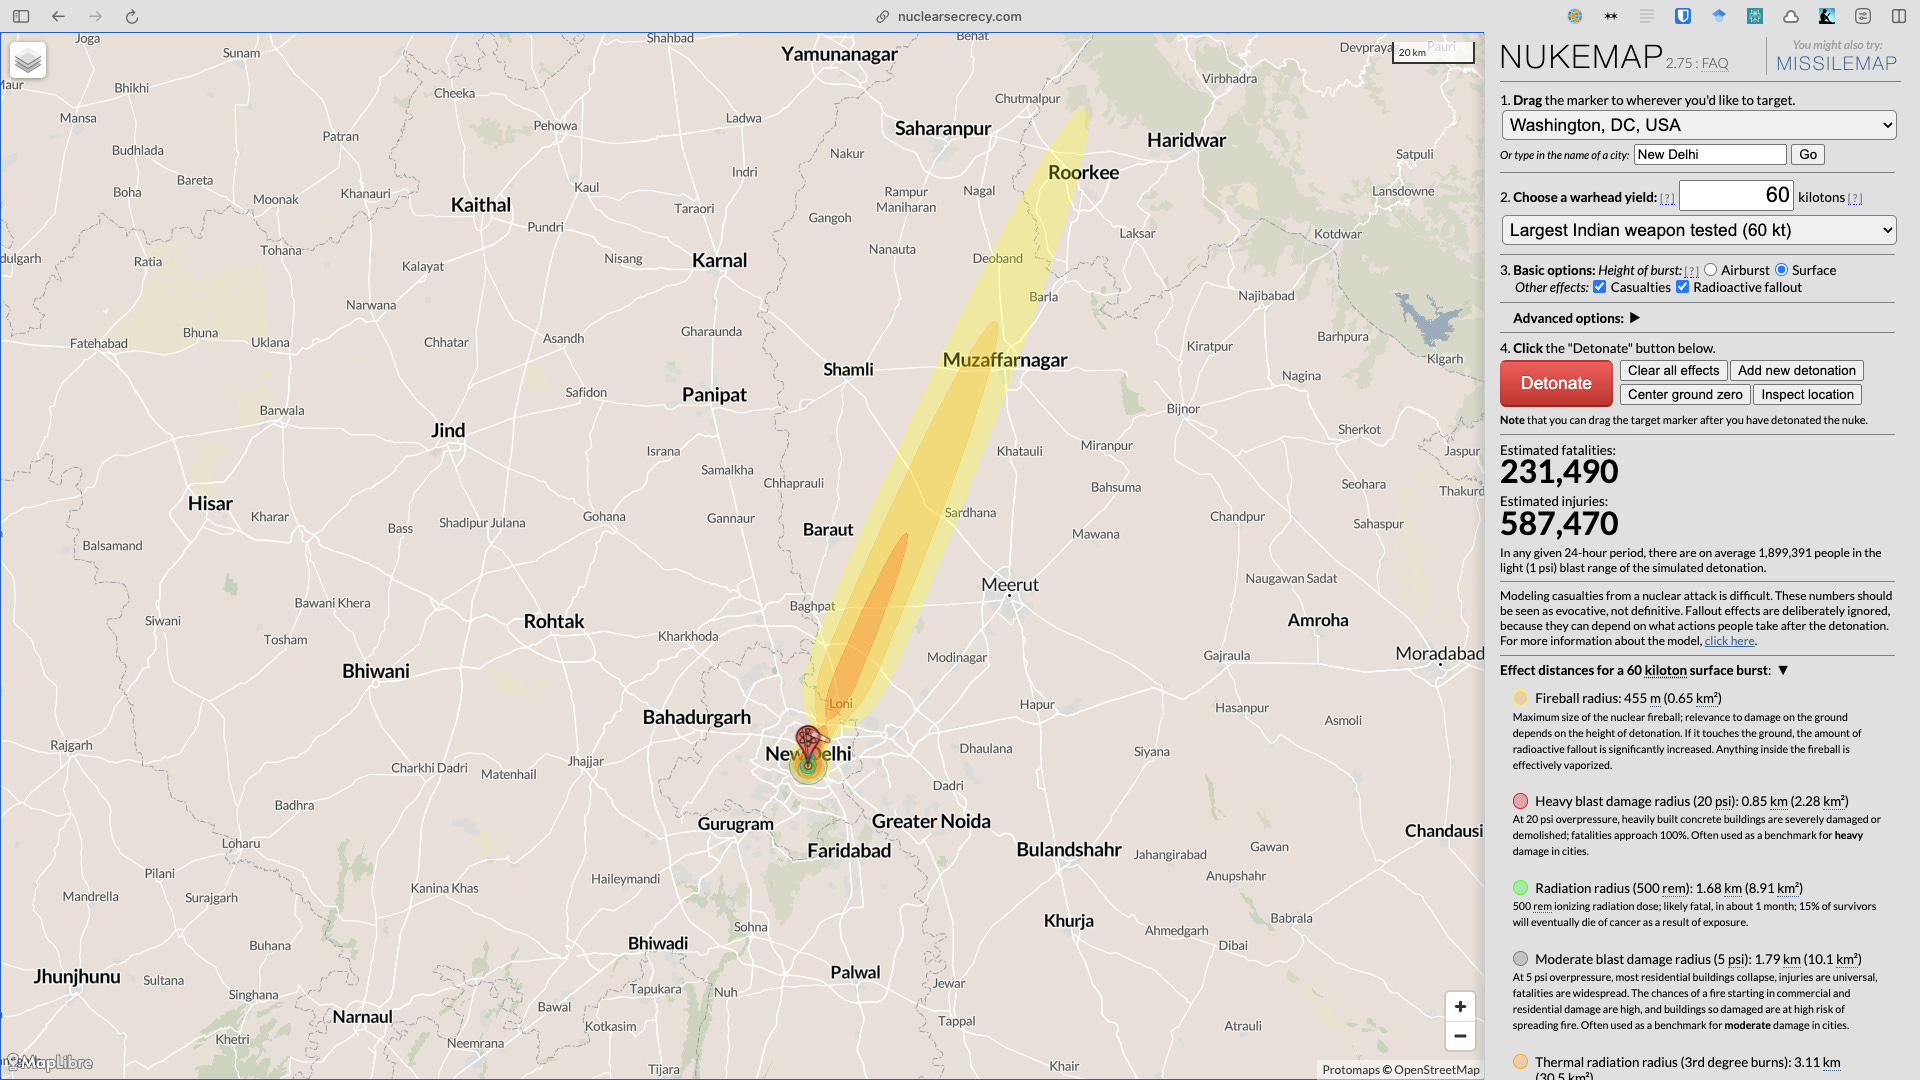
Historian Alex Wellerstein from Stevens Institute of Technology is an expert in Nuclear history of USA. He created this map of Nuclear Fallout in case a bomb drops upon us.
Here’s what would happen to Washington DC if the Nagasaki bomb is dropped (79k fatalities and 113k injuries):

Here’s how New Delhi would be affected if the largest of Indian nuclear bomb is dropped (231k fatalities and 587k injuries):
Here’s how Moscow will be affected if the largest USSR bomb is dropped (8370k fatalities and 2865k injuries):

This gives us some hint of how easily can we erase human life and everything we hold so dear to us. Play around with the map if you’d like. I’ve also found his other writings interesting, including Tokyo vs Hiroshima and What did the Nazis know about the Manhattan Project?
Flight Datasets 🔒
Last month, I was flying from India to US, and my flight from Ranchi, JH to New Delhi was running three hours late due to low visibility in Delhi (classic Delhi smog). I started exploring historical travel times of Indigo (largest airline in India with 60% market share) and landed at this interesting dataset.
OAG provides global airline schedules, flight status, flight history, flight seats, connection times, passenger booking, flight emissions, and airfare datasets. The datasets are paywalled but considering the wealth of information, maybe it’s justified.
Nero.AI: LLM Powered Web-scrapper 💰
Until recently, I had to rely on SelectorGadget, rvest, BeautifulSoup and wget. Not anymore. Not only LLMs have made the scraping process a lot easier, now there are LLM-native solutions for web scraping.
Nero.AI is designed for LLM apps. It cleans the text so that they are directly used within embeddings. They utilize structured markdown for storing information, sans formal tidbits of HTML. Like many modern solutions, it can also handle Captcha, JS rendering, browser fingerprinting, and more. The fees charged depends on usage.
Six not-so-basic R functions
Isabella Velásquez’s blog provides interesting insights into several lesser-known-but-useful functions in R. Most of them were completely new to me even after 8+ years of using R.
invisible(): This function creates an invisible copy of an object, useful for executing functions without printing their results to the console, thereby reducing clutter.nzchar(): This function quickly checks if elements of a character vector are non-empty strings, proving useful in various data manipulation tasks.lengths(): This is an efficient alternative tosapply(df, length)for determining the lengths of elements across columns in a data frame.
Definitely a good read.
71% of Asian restaurants in the U.S. serve Chinese, Japanese or Thai food
According to an urban legend (which has been validated):
Thai government has been invested in this [training cooks] to promote Thai cuisine. It's part of their economic national development plan that was started around the early 2000s. They train chefs and export them everywhere around the world to open and work in restaurants. It’s to stimulate tourism to Thailand, but it's also an effort to standardize Thai taste around the world because the government feels like the different kinds of Thai food around the world has given it somewhat of a bad name.
While Asian Americans constitute 7% of the U.S. population, 12% of all U.S. restaurants serve Asian food. And despite Thai government’s best efforts, Chinese food still tops the list of Asian restaurants.

Indian and Filipino establishments account for only 7% and 1% of all Asian restaurants in US, even though Indian and Filipino Americans account for nearly 40% of Asians in US.
Like the Asian American population, Asian restaurants in the U.S. are heavily concentrated in a few states. More than half of U.S. Asians (55%) live in five states: California, New York, Texas, New Jersey and Washington. And just under half of all Asian restaurants – 45% – are located in those five states.
Pandana: Python library for Spatial Analysis
Pandana is a Python library designed for network-based spatial analyses and data aggregation. It allows users to compute accessibility to various locations in a city by aggregating data along a transportation network, creating a smooth surface over the area for the variable of interest.
The library enables quick performance of walking-scale accessibility queries and supports different types of aggregations, including sum, mean, and standard deviation, with various decay functions. For more details, you can visit the documentation.
Leafmap: Python library for Interactive Mapping
Leafmap is a Python package designed for geospatial analysis and interactive mapping in Jupyter environments. It simplifies the process of visualizing and analyzing geospatial data, offering capabilities such as creating interactive maps with minimal coding, displaying vector and raster data, and integrating various mapping backends like ipyleaflet and folium.
It is a spin-off project of the geemap Python package, which was designed specifically to work with Google Earth Engine (GEE). However, not everyone in the geospatial community has access to the GEE cloud computing platform. Leafmap is designed to fill this gap for non-GEE users.
It is a free and open-source Python package that enables users to analyze and visualize geospatial data with minimal coding in a Jupyter environment, such as Google Colab, Jupyter Notebook, and JupyterLab.
PyDeck: Python library for 3D visualization
PyDeck, like Rayshader in R, is a powerful tool for 3D visualization of geospatial data. PyDeck is a Python library that leverages the capabilities of deck.gl to render high-scale spatial data interactively. It's particularly well-suited for visualizing large datasets and creating compelling, visually rich maps.
It integrates smoothly with Jupyter notebooks, enhancing data exploration and presentation. PyDeck excels in rendering complex layers like scatterplots, heatmaps, and geospatial networks, providing an intuitive and interactive user experience. More details can be found on their official website.
👒 Hat-tip to Dea for Pandana, Leafmap and Pydeck.
Real-life Examples of Data-overfitting
XKCD.com gave the best example of data-overfitting using US presidential elections as an example. Other examples are also interesting. Ptolemy’s geocentric system is also a great historical example.

2023 Wrapped: A Year of Sickness and Health

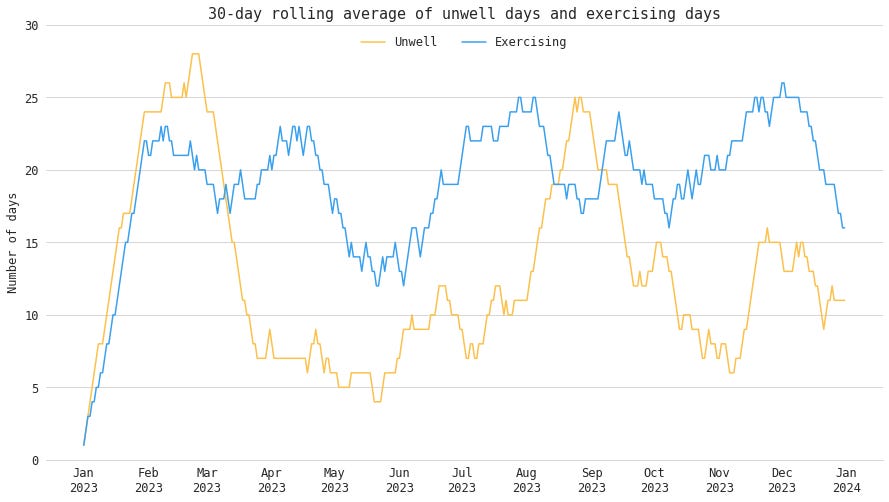
"2023 Wrapped: a year of sickness and health" by Yennie Jun offers insights from her personal data analysis to understand her health patterns. She collected data from sources like Google Maps, Apple Health, and daily surveys to analyze wellness cues, exercise habits, geographic impacts on health, and menstrual cycle correlations.
She spent nearly two months with some cold and 1.5 months with cramps. In total, she was unwell for 161 days in the year! Exercising and being unwell does seem to have an inverse effect.
Bonus: She also analyzed how she cried in 2022.
Bonus bonus: Jennifer (@vegantechnomad on Instagram) also shares such insights from her life tracking systems. Like in this post, she analyzed her pooping habits. 💩
That’s a wrap!
I do have some more stories but Substack says this is the maximum email length. You can access my full collection of articles on Raindrop for perusal. See you next month!
Harsh