
From Autonomous Agents to Visualization Techniques
Next — Today I Learnt About Data Science | Issue #77

Hi there!
Today, we're going to talk about a variety of exciting topics ranging from autonomous agents powered by Large Language Models (LLMs) to new ways of visualizing your data. We'll also delve into some critical discussions on data science, compare the performance of popular programming languages, and introduce you to some useful tools and packages. Like always, to top it all off, we'll demystify some jargons, share some interesting tweets, and end with a fun meme. So, let's dive right in!
Five Stories
LLM Powered Autonomous Agents
The blog post by Lilian Weng discusses the concept of building autonomous agents powered by Large Language Models (LLMs). The agents are designed with key components such as planning, memory, and tool use. The post explores various techniques and models for task decomposition, self-reflection, and memory management. It also highlights the potential of LLMs as powerful general problem solvers, extending beyond generating well-written copies, stories, essays, and programs.
Splink: Data Linkage at Scale
Splink is a tool developed by the Ministry of Justice Analytical Services for probabilistic data linkage. It offers features for data deduplication and record linkage, working best with large datasets that contain some level of error. The vignette provides a range of tutorials, examples, and comprehensive documentation to assist users in their data linkage tasks.
Splink's "Real Time Record Linkage" is an example of its powerful capabilities. This feature allows users to load a pre-trained linkage model and compare two records in real time. It also provides an interactive interface for finding matching records, which can be particularly useful in scenarios where new data is constantly being added and needs to be linked with existing records.
Beyond Bar Charts: Visualize your data in new ways
In her Medium article, "Beyond Bar Charts: Visualize your data in new ways," Angela Kokhtenko encourages data analysts to explore alternative methods of data visualization. She presents a variety of chart types, such as the Stacked Row Chart, Pictograms, Radial bars, and good old table (my fav.), which can provide more nuanced insights than traditional bar charts.
The article also refers to other resources, like D3Blocks, a Python library for creating interactive D3js charts, and guides on creating beautiful graphs with Python.
A Very Dangerous Data Science Article
The Harvard Business Review article "Prioritize Which Data Skills Your Company Needs with This 2×2 Matrix" is criticized for its flawed approach to data science. It uses a cost-benefit matrix to determine which data skills to invest in, assuming these skills can be considered independently. This could misinform organizations' data strategies, causing issues for data professionals. Keith McNulty highlights the danger of oversimplifying data science and the importance of understanding the interdependence of data skills.
How does Python 3.11 perform against R and Julia
The article compares the performance of Python 3.11 with R and Julia. It highlights that despite improvements, Python 3.11 lags behind due to the Global Interpreter Lock (GIL), dynamic typing, and its legacy codebase. GIL limits multi-threaded applications, dynamic typing slows execution, and the large codebase makes optimization challenging. The author suggests that Python's strengths lie in its versatility and extensive library support, rather than raw performance.
Four Packages
Splink is a tool developed by the Ministry of Justice Analytical Services for probabilistic data linkage. It offers features for data deduplication and record linkage, working best with large datasets that contain some level of error. Github.
dwctaxon is an R package to facilitate working with Darwin Core Taxon data in R. Github. Vignette.
Handling dates in Python is a nightmare with multiple pandas, numpy and native formats. While it is certainly easier in R, what if your original data has multiple formats? That’s where datefixR comes handy. Github. Vignette.
spelling is for spell checking common document formats including latex, markdown, manual pages, and description files. Github. Vignette.
Three Jargons
Credible Interval: A credible interval is a concept from Bayesian statistics. It represents a range within which an unknown parameter is likely to fall, given the observed data and prior knowledge. For example, a 95% credible interval means that there is a 95% probability that the true value of the parameter lies within this range, given the data and the prior. This is a direct probability statement about the parameter.
P-Value: A p-value is a concept from frequentist statistics used in hypothesis testing. It represents the probability of obtaining the observed data (or data more extreme) if the null hypothesis is true. A small p-value (typically ≤ 0.05) indicates strong evidence against the null hypothesis, leading us to reject it. However, it does not tell us the probability that the null hypothesis is true.
Confidence Interval: A confidence interval is also a concept from frequentist statistics. It is a range of values estimated to contain the true population parameter with a certain level of confidence. For example, a 95% confidence interval means that if we repeated our study many times, 95% of the time our interval would contain the true population parameter. However, it does not give the probability that the specific interval calculated from a given sample contains the true parameter value.
In summary, while p-values and confidence intervals are frequentist concepts related to repeated sampling, a credible interval is a Bayesian concept that provides a direct probability statement about the parameter.
Two Tweets
https://twitter.com/RandVegan/status/1673155398315167744
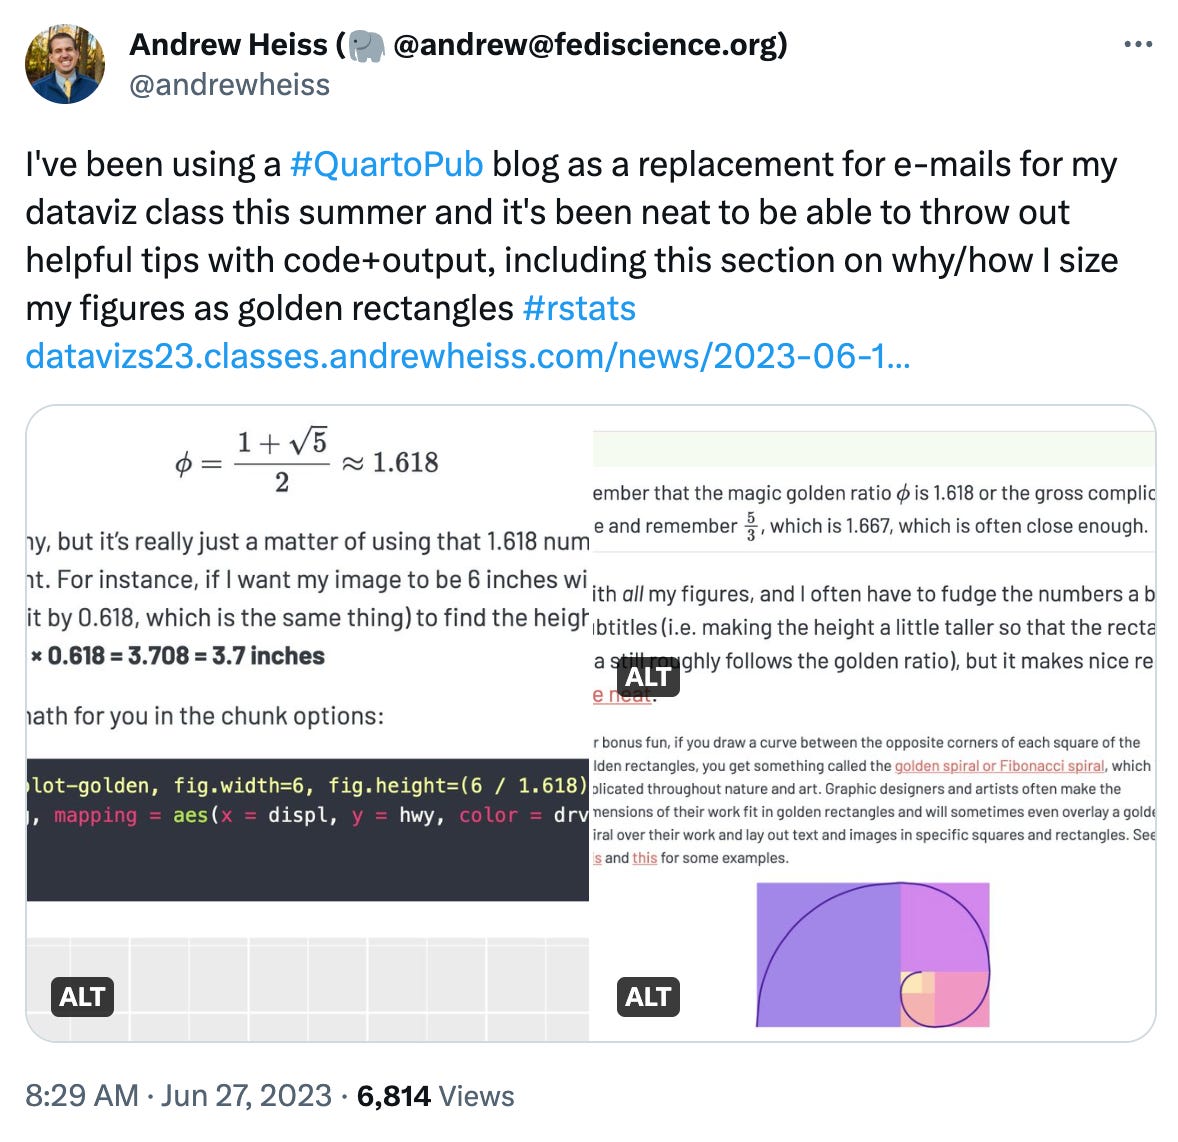
https://twitter.com/andrewheiss/status/1673715306026639360
One Meme

https://twitter.com/TomValletti/status/1673752280909185024
— Harsh