Hi there!
Today’s stories will tell you about patterns in Albanian street names, how to use Github Copilot for R, college students’ opinion on ChatGPT and more.
Let’s dive in.
Five Stories
How are businesses using ChatGPT?
OpenAI
Last week, OpenAI released APIs for their most recent model that powers ChatGPT at a 10x cheaper prices. Furthermore, they also released APIs for Whisper, a speech to text engine designed for multilingual transcription which was open-sourced over a year ago.
In this blog, OpenAI demonstrates how different companies are using their tech to build interesting features. Like, Snap included My AI — a chat bot within the app. Quizlet has a fully-adaptive tutor for teaching you literally anything. You can ask Instacart for lunch ideas and it’ll plan grocery shopping for you. Notion AI can help you plan and execute. And more.
With the API cost so low, $0.002 per 1K tokens, I think there will be many new apps coming in with the capability.
Hidden Patterns in Street Names [Part 2]
Dea Bardhoshi
I wrote about Dea’s analysis of Albanian street names a few weeks ago. In a yet another curious piece, Dea discovers who are these people who get this privilege.
The biggest group seems to be politicians, writers and fighters. (These are based on manual labelling by her; kudos for industrious effort.) Which politicians? Late 19th and early 20th century. Communist politicians are the fourth biggest category. Others in the Top-20 are photographers, researchers, and more.
Github Copilot for R
David Smith
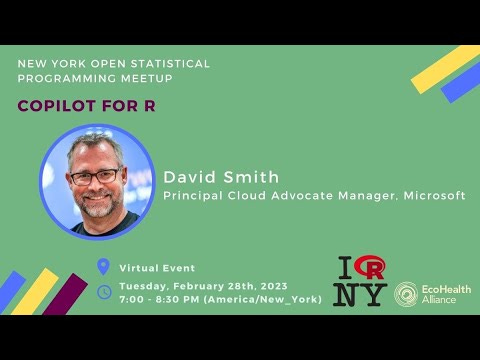
David Smith presented a talk to the NYC Data Hackers on how to use Copilot for R in Visual Studio Code and how it works behind the scenes with OpenAI Codex and Azure OpenAI Service. He showed how to access OpenAI’s Codex and other models from R, and how to tidy datasets with Tidyverse. Github repo.
I’ve used Copilot for a long time with Python. Maybe it’s time I checked it for R!
College students aren’t excited about ChatGPT
Neal Freyman, Morning Brew
In a very small sample study by Morning Brew/Generation Lab, journalists found that 40% of college students had never heard of ChatGPT. Of those who had heard of it, more than half (52%) had never tried it.
Most of those who use it (71%), use it for entertainment, while a significant portion (32%) use it for quick answers. Only 17% reported they knew someone who had cheated using ChatGPT.
Of course, self-reported numbers don’t mean much but maybe educators don’t have much to be scared of.
Data from satellites reveal the vast extent of fighting in Ukraine
The Economist
The Economist used satellite data from NASA and Sentinel-1 to track the extent and impact of the war in Ukraine, which has affected 14% of municipalities and damaged many buildings. By combining two satellite-based systems that detect fires and changes in building signals, journalists were able to map the war in Ukraine more comprehensively than social media sources.
The satellite data revealed that fighting was not limited to the front lines, but also occurred in areas far from the conflict zone. The data also showed that Ukraine increased its use of American rockets after June last year.
Four Packages
DataExplorer helps you explore and visualise your data. It’s create_report() is absolute blast. The function can generate basic statistics, data structure, missing data profile, distributions, correlations and PCA in a single R Markdown report. Github.
esquisse adds a drag-and-drop interface for creating plots in R. Simple Shiny app, hugely useful! Github.
calendR can create ready to print calendars with ggplot2. Quite handy. Github.
generativeart can create wonderful art based on mathematical formulations. Check it’s Github to see what it can do.
Three Jargons
Bucketing: A mechanism for grouping categorical data, especially when the number of categories is large, but the number of categories actually appearing in the data is comparatively small.
Cross-validation: A technique for assessing the performance of a machine learning model by splitting the data into multiple subsets and using some of them for training and some of them for testing.
Confounding: A situation where the relationship between a predictor and an outcome variable is distorted by the presence of another variable that affects both of them.
Two Tweets


One Meme
Bonus
Learn history by visually exploring maps at History Maps. Here’s the one for Indian History. Pretty cool!


