

What is the sound of Facebook’s value crashing? | Next - Issue #55
What is the sound of Facebook’s value crashing? | Next - Issue #55

Five Stories
When I met my boyfriend, I sometimes felt a tinge of regret that we never got to make an adorable meet-cute story, despite living in the same city for five years and attending the same university. Our story isn’t unique from many couples in 2020- in a trough between COVID waves, we started speaking online, on Bumble, a dating app.
She uses Google's location history to track their paths over the five years of living in the same city Cape Town, South Africa and attending the same university. How many times did they cross paths before they started dating? Check out how to visualise your Google location data in R. Spoiler alert: there were 33 occasions where they may have crossed paths, mostly on campus.
I first came across charts with musical notes (data sonification) when India in Pixels visualized how much money was transacted via UPI, India's cashless payment system. Nick Evershed built a general tool that made creating data sonification charts easy. These charts are especially useful for showing sudden changes. On this page, you can see how Zukerberg's wealth changed, Sydney's waterfall, and more.
In 2014, Tactical Technology Collective used this to raise awareness of the problem of the sudden collapse of residential buildings in Egypt due to poor construction regulations. Plus, they also make charts accessible to people with low or poor vision. Now, they can visualise it as well.
"Blogs have been written, Twitter wars have been fought, and careers have been made fighting over native vs magrittr pipes", said nobody. Katie presents several exciting points about Native R pipes. First, the "." notation doesn't work. The "_" placeholder has a limited use case. Second, its use case is limited to functional programming cases like purrr. You almost always need an anonymous function for the task (like the Lambda function in Python).
Third, using [.] and [[.]] is not straightforward. You need an anonymous function. Even then, the syntax is not concise. The BIG plus point is that it looks pretty with Fira Code font in RStudio.
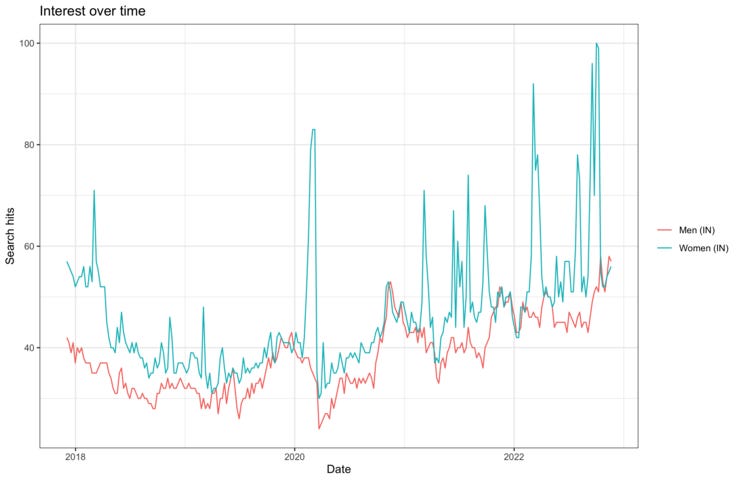
The gtrendsR package is an R package that can be used to programmatically gather and display Google trend information. The function is really simple to use. You can provide the terms, geography, time, type of Google product, etc.
trends = gtrends(c("Men", "Women"), geo ="IN")
To plot it, you can use plot(trends). For interactive plotting, use plotly::ggplotly(trends).
In this screencast, Julia Silge covers how to do model tuning in a tidymodels environment. The case is about food habits where we have data on the consumption of poultry, beef, lamb/goat, milk, eggs, rice, etc., for each country, and we have to predict if the country is Asian or not. With GGally's ggscatmat() function, she makes a pair plot showing that rice is an important determinant.
She fits a random forest model with the ranger engine, running multiple processes in parallel using doParallel library. Finally, she finds the best combination by comparing the metrics. Here are the codes!
Four Packages
gtrendsR provides functions for retrieving Google Trends data into R for free. See GitHub to learn more.
GGally extends ggplot2 by adding several functions for making a pairwise plot matrix, a scatterplot plot matrix, a parallel coordinates plot, a survival plot, and several functions to plot networks. Vignette.
doParallel and foreach are packages used for parallel processing in R. They're almost always used in parallel. They provide a pipe-like functional %dopar% for parallel processing. Vignette.
Three Jargons
Kerning refers to the space between characters of a font. It makes the text more visually pleasing than placing one character next to another.
A recursive function is a function that calls itself during its execution. This enables the function to repeat itself several times, returning the result of each iteration.
A packet is a small piece of data sent over a network. Whenever you collect information from the Internet, like opening a website, your browser grabs these packets from web servers. Each packet contains the address of its origin and destination, and the information itself.
Two Tweets


One Meme

That's a wrap!
I hope you enjoyed today’s letter. If you enjoy the newsletter and would like to support it, you can buy me a coffee here. See you next week!
Harsh